Is the climate warming?
Yes. Global surface temperatures have increased about 0.6°C (plus or minus 0.2°C) since the late-19th century, and about 0.4°F (0.2 to 0.3°C) over the past 25 years (the period with the most credible data). The warming has not been globally uniform. Some areas (including parts of the southeastern U.S.) have, in fact, cooled over the last century. The recent warmth has been greatest over North America and Eurasia between 40 and 70°N. Warming, assisted by the record El Niño of 1997-1998, has continued right up to the present, with 2001 being the second warmest year on record after 1998.
Linear trends can vary greatly depending on the period over which they are computed. Temperature trends in the lower troposphere (between about 2,500 and 26,000 ft.) from 1979 to the present, the period for which Satellite Microwave Sounding Unit data exist, are small and may be unrepresentative of longer term trends and trends closer to the surface. Furthermore, there are small unresolved differences between radiosonde and satellite observations of tropospheric temperatures, though both data sources show slight warming trends. If one calculates trends beginning with the commencement of radiosonde data in the 1950s, there is a slight greater warming in the record due to increases in the 1970s. There are statistical and physical reasons (e.g., short record lengths, the transient differential effects of volcanic activity and El Niño, and boundary layer effects) for expecting differences between recent trends in surface and lower tropospheric temperatures, but the exact causes for the differences are still under investigation (see National Research Council report "Reconciling Observations of Global Temperature Change").
An enhanced greenhouse effect is expected to cause cooling in higher parts of the atmosphere because the increased "blanketing" effect in the lower atmosphere holds in more heat, allowing less to reach the upper atmosphere. Cooling of the lower stratosphere (about 49,000-79,500ft.) since 1979 is shown by both satellite Microwave Sounding Unit and radiosonde data, but is larger in the radiosonde data.
Relatively cool surface and tropospheric temperatures, and a relatively warmer lower stratosphere, were observed in 1992 and 1993, following the 1991 eruption of Mt. Pinatubo. The warming reappeared in 1994. A dramatic global warming, at least partly associated with the record El Niño, took place in 1998. This warming episode is reflected from the surface to the top of the troposphere.
There has been a general, but not global, tendency toward reduced diurnal temperature range (DTR), (the difference between high and low daily temperatures) over about 50% of the global land mass since the middle of the 20th century. Cloud cover has increased in many of the areas with reduced diurnal temperature range. The overall positive trend for maximum daily temperature over the period of study (1950-93) is 0.1°C/decade, whereas the trend for daily minimum temperatures is 0.2°C/decade. This results in a negative trend in the DTR of -0.1°C/decade.
Indirect indicators of warming such as borehole temperatures, snow cover, and glacier recession data, are in substantial agreement with the more direct indicators of recent warmth. Evidence such as changes in glacier length is useful since it not only provides qualitative support for existing meteorological data, but glaciers often exist in places too remote to support meteorological stations, the records of glacial advance and retreat often extend back further than weather station records, and glaciers are usually at much higher alititudes that weather stations allowing us more insight into temperature changes higher in the atmosphere.
Large-scale measurements of sea-ice have only been possible since the satellite era, but through looking at a number of different satellite estimates, it has been determined that Arctic sea ice has decreased between 1973 and 1996 at a rate of -2.8 +/- 0.3%/decade. Although this seems to correspond to a general increase in temperature over the same period, there are lots of quasi-cyclic atmospheric dynamics (for example the Arctic Oscillation) which may also influence the extent and thickness of sea-ice in the Arctic. Sea-ice in the Antarctic has shown very little trend over the same period, or even a slight increase since 1979. Though extending the Antarctic sea-ice record back in time is more difficult due to the lack of direct observations in this part of the world.
skip to main |
skip to sidebar


![]()

SAVE WATER.


Gone are the dull book days !!!!!!

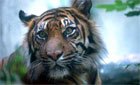
symmetry in a tiger

smart classroom

Kulachi Hansraj Model School

Use dustbins!

The key to the protection and care of the Earth


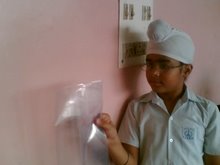
Opaque objects cast distinct shadows

Karanjot V B
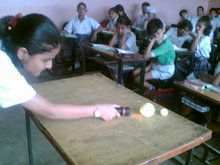
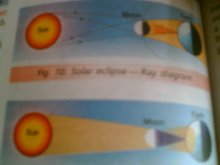
Shadows and eclipses
Love and care your environment!
A PLEDGE BY YOUNG KULACHIANS TO SAVE THE EARTH!
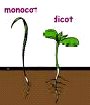
Monocot and Dicot seed

The only living things to capture Sun's energy
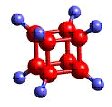

atoms

WELCOME TO MY FUN SCIENCE BLOG
I am Savita Dhutti,a science teacher at a well established public school in India.I welcome all of you to My science mania ! Its a website,I created for sharing e-learning experience with my students.Science is in fact, a real fun.It is a subject never--never confined within the four walls of the clssroom.Science is a continuous process of learning! I wish to create a pleasing learning environment for my students.So, Come and ENJOY Science with me.
class 8 BIOLOGY H HW
Biology
Make a project on the following topic
Microorganisms
The following aspects should be properly covered.
- Different group of microorganisms 5 characteristics of each
Algae, Fungi, Bacteria, Protozoa, Virus Microorganisms as friends in Food, Medicine, Agriculture, Nature, Industry and Microorganisms as Foes.
Use A4 size sheets and put them inside an Eco friendly Folder.
Be thorough with whatever you write, you will be orally assessed.
Labels
- A CALL for the students....... (6)
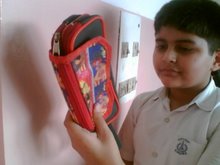
- A student showing solar eclipse (1)
- An Intelligent mind rests in a healthy body. (1)
- BIOLOGY (1)
- Body systems diagrams for practice (2)
- Chant Gayatri Mantra daily and live life fully. (1)
- class 8 HHW BIOLOGY (10)
- CLASS VII HOLIDAYS HOME WORK (8)
- click to enlarge and print (1)
- cow dung.holidays home work reference (18)
- electric current (13)
- fabric from fiber (4)
- food class 6th (24)
- global concern (8)
- global warming (6)
- Information (1)
- Information: symmetry (2)
- Jupiter facts (1)
- life cycles of animals (1)
- light and shadows (4)
- link to my slideshow (1)
- magnets (2)
- nature of matter (2)
- plant structure and function (7)
- plants (9)
- plants image gallary (2)
- properties of matter (3)
- puzzle clues (1)
- Seed germination (1)
- SHIVLING AT the AMARNATH TEMPLE HAS MELTED. (1)
- Student Activity (43)
- student Corner (47)
- student information (10)
- Syllabus Class V / SCIENCE / FIRST TERM (1)
- Take A break (1)
- water facts (6)
- word bank plants (2)
- work and energy (11)
- धरती को बचाने की कोशिश (1)
- प्लांट growth (1)
Total Pageviews
shadow dancing
Facebook Badge
e teachers of india my badge
Student Activity April 2009


sandwich making activity


electricity activity
HOLIDAYS HOME WORK DISPLAY


activity clicks


welcome to my science mania!!!!!!!
I am Savita Dhutti,a science teacher at a well established public school in India.I welcome all of you to My science mania ! Its a website,I created for sharing e-learning experience with my students.Science is in fact, a real fun.It is a subject never--never confined within the four walls of the clssroom.Science is a continuous process of learning! I wish to create a pleasing learning environment for my students.
So, Come and ENJOY Science with me.
So, Come and ENJOY Science with me.
global warming
NeoCounter
NeoPod
NeoFlags
EVERY DROP OF WATER IS PRECIOUS.
SAVE WATER.
water
VI H celebrating Talent Show 2007
Labels
- A CALL for the students....... (6)
- A student showing solar eclipse (1)
- An Intelligent mind rests in a healthy body. (1)
- BIOLOGY (1)
- Body systems diagrams for practice (2)
- Chant Gayatri Mantra daily and live life fully. (1)
- class 8 HHW BIOLOGY (10)
- CLASS VII HOLIDAYS HOME WORK (8)
- click to enlarge and print (1)
- cow dung.holidays home work reference (18)
- electric current (13)
- fabric from fiber (4)
- food class 6th (24)
- global concern (8)
- global warming (6)
- Information (1)
- Information: symmetry (2)
- Jupiter facts (1)
- life cycles of animals (1)
- light and shadows (4)
- link to my slideshow (1)
- magnets (2)
- nature of matter (2)
- plant structure and function (7)
- plants (9)
- plants image gallary (2)
- properties of matter (3)
- puzzle clues (1)
- Seed germination (1)
- SHIVLING AT the AMARNATH TEMPLE HAS MELTED. (1)
- Student Activity (43)
- student Corner (47)
- student information (10)
- Syllabus Class V / SCIENCE / FIRST TERM (1)
- Take A break (1)
- water facts (6)
- word bank plants (2)
- work and energy (11)
- धरती को बचाने की कोशिश (1)
- प्लांट growth (1)
Its e-teaching time now!!!!!!!!!!!
Gone are the dull book days !!!!!!
CII Shiksha India's website
CII SHIKSHA INDIA IS A NON PROFIT ORGANIZATION ........
CII SHIKSHA INDIA IS A NON PROFIT ORGANIZATION ........WHICH STARTED ITS .........
e-teaching learning portal in January 2007 inagurated by President Abdul Kalam Azad and is continuously guiding teachers to work in collaboration on Shiksha portal for taking India to the new horizons of E-teaching learning.I have been assosiated with it and working on e-teaching learning.The portal had announced a contest for its teachers for contribution to the portal and myself ,the recipient of the award is happy to be assosiated to the portal and in being able to explore net and other e-tools for teaching.
e-teaching learning portal in January 2007 inagurated by President Abdul Kalam Azad and is continuously guiding teachers to work in collaboration on Shiksha portal for taking India to the new horizons of E-teaching learning.I have been assosiated with it and working on e-teaching learning.The portal had announced a contest for its teachers for contribution to the portal and myself ,the recipient of the award is happy to be assosiated to the portal and in being able to explore net and other e-tools for teaching.
symmetry
symmetry in a tiger
e-learning is fun!
smart classroom
alphabets in nature
This album is powered by BubbleShare - Add to my blog
MY SCHOOL
Kulachi Hansraj Model School
KULACHI BLOGGERS CLUB
Manage the waste
Use dustbins!
Student Awareness
The key to the protection and care of the Earth
Protecting Earth together
Student corner
- 1. Poem by Megha Panjwani VI H
- 2. Vasu Mittal says........
- 3. Poem by Manmeet Kaur VI H
Do you think talent shows in the school are worth it or a wastage of time?
Items for the talent show of my class
- On the spot Poetry competition
- science facts
- Making invitation cards for the guests
- Rangoli making
- wecome song by girls
- art and craft display
- Singing bhajan
- folk dance boys(solo)
- folk dance girls(solo)
- group dance by boys
- group dance by girls
- drama
- playing music instument
- short humourous skit
solar eclipse
shadow formation activity PARAS V B
Opaque objects cast distinct shadows
global warming
Shadow is not formed by transparent objects
Karanjot V B
class V activity
Shadows and eclipses
url=http://savitadhuttimyscienceatkulachi.blogspot.com" id="clustrMapsLink">
click for the details
time is ticking away fast
Labels
- A CALL for the students....... (6)
- A student showing solar eclipse (1)
- An Intelligent mind rests in a healthy body. (1)
- BIOLOGY (1)
- Body systems diagrams for practice (2)
- Chant Gayatri Mantra daily and live life fully. (1)
- class 8 HHW BIOLOGY (10)
- CLASS VII HOLIDAYS HOME WORK (8)
- click to enlarge and print (1)
- cow dung.holidays home work reference (18)
- electric current (13)
- fabric from fiber (4)
- food class 6th (24)
- global concern (8)
- global warming (6)
- Information (1)
- Information: symmetry (2)
- Jupiter facts (1)
- life cycles of animals (1)
- light and shadows (4)
- link to my slideshow (1)
- magnets (2)
- nature of matter (2)
- plant structure and function (7)
- plants (9)
- plants image gallary (2)
- properties of matter (3)
- puzzle clues (1)
- Seed germination (1)
- SHIVLING AT the AMARNATH TEMPLE HAS MELTED. (1)
- Student Activity (43)
- student Corner (47)
- student information (10)
- Syllabus Class V / SCIENCE / FIRST TERM (1)
- Take A break (1)
- water facts (6)
- word bank plants (2)
- work and energy (11)
- धरती को बचाने की कोशिश (1)
- प्लांट growth (1)
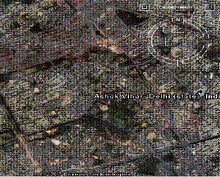
my school's location through google earth
calender
clicks on my blog
Science is not just a subject of teaching learning.It is a way of knowing about,thinking about and caring about the environment of which we are a part.
Labels
- A CALL for the students....... (6)
- A student showing solar eclipse (1)
- An Intelligent mind rests in a healthy body. (1)
- BIOLOGY (1)
- Body systems diagrams for practice (2)
- Chant Gayatri Mantra daily and live life fully. (1)
- class 8 HHW BIOLOGY (10)
- CLASS VII HOLIDAYS HOME WORK (8)
- click to enlarge and print (1)
- cow dung.holidays home work reference (18)
- electric current (13)
- fabric from fiber (4)
- food class 6th (24)
- global concern (8)
- global warming (6)
- Information (1)
- Information: symmetry (2)
- Jupiter facts (1)
- life cycles of animals (1)
- light and shadows (4)
- link to my slideshow (1)
- magnets (2)
- nature of matter (2)
- plant structure and function (7)
- plants (9)
- plants image gallary (2)
- properties of matter (3)
- puzzle clues (1)
- Seed germination (1)
- SHIVLING AT the AMARNATH TEMPLE HAS MELTED. (1)
- Student Activity (43)
- student Corner (47)
- student information (10)
- Syllabus Class V / SCIENCE / FIRST TERM (1)
- Take A break (1)
- water facts (6)
- word bank plants (2)
- work and energy (11)
- धरती को बचाने की कोशिश (1)
- प्लांट growth (1)
Class VI Students ! Refer this site for help in your Science Project given as Holidays H.W.
Saving Earth's Resources
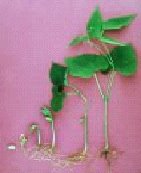
seed germination
Planting a green friend -- a sapling !
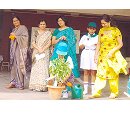
Love and care your environment!
a pledge by the Students in the VANAMAHOTSAVA function
A PLEDGE BY YOUNG KULACHIANS TO SAVE THE EARTH!
plant growth
Seed Germination
Monocot and Dicot seed
A Typical Flowering Plant
The only living things to capture Sun's energy
Labels
- A CALL for the students....... (6)
- A student showing solar eclipse (1)
- An Intelligent mind rests in a healthy body. (1)
- BIOLOGY (1)
- Body systems diagrams for practice (2)
- Chant Gayatri Mantra daily and live life fully. (1)
- class 8 HHW BIOLOGY (10)
- CLASS VII HOLIDAYS HOME WORK (8)
- click to enlarge and print (1)
- cow dung.holidays home work reference (18)
- electric current (13)
- fabric from fiber (4)
- food class 6th (24)
- global concern (8)
- global warming (6)
- Information (1)
- Information: symmetry (2)
- Jupiter facts (1)
- life cycles of animals (1)
- light and shadows (4)
- link to my slideshow (1)
- magnets (2)
- nature of matter (2)
- plant structure and function (7)
- plants (9)
- plants image gallary (2)
- properties of matter (3)
- puzzle clues (1)
- Seed germination (1)
- SHIVLING AT the AMARNATH TEMPLE HAS MELTED. (1)
- Student Activity (43)
- student Corner (47)
- student information (10)
- Syllabus Class V / SCIENCE / FIRST TERM (1)
- Take A break (1)
- water facts (6)
- word bank plants (2)
- work and energy (11)
- धरती को बचाने की कोशिश (1)
- प्लांट growth (1)
molecules in nature
"Welcome to the planet science"
Welcome to the exciting world of Science!
This is my planet science-----A fun filled planet full of multiple activities,interesting videos, thought provoking articles on contemporary science issues,puzzles , compiled images and much more.....
Atoms---- the constituent particles of matter
atoms
Blog Archive
-
▼
2007
(134)
- ► 05/06 - 05/13 (13)
- ► 05/13 - 05/20 (19)
- ► 05/20 - 05/27 (13)
- ► 05/27 - 06/03 (11)
- ► 06/10 - 06/17 (1)
- ▼ 07/01 - 07/08 (4)
- ► 07/08 - 07/15 (11)
- ► 07/15 - 07/22 (11)
- ► 07/29 - 08/05 (11)
- ► 08/05 - 08/12 (3)
- ► 08/12 - 08/19 (12)
- ► 08/19 - 08/26 (3)
- ► 09/09 - 09/16 (10)
- ► 09/16 - 09/23 (3)
- ► 09/30 - 10/07 (3)
- ► 10/07 - 10/14 (2)
- ► 12/09 - 12/16 (4)
-
►
2008
(137)
- ► 01/06 - 01/13 (2)
- ► 01/13 - 01/20 (3)
- ► 01/20 - 01/27 (6)
- ► 01/27 - 02/03 (11)
- ► 02/10 - 02/17 (2)
- ► 02/17 - 02/24 (2)
- ► 03/16 - 03/23 (2)
- ► 03/23 - 03/30 (3)
- ► 03/30 - 04/06 (1)
- ► 04/06 - 04/13 (33)
- ► 05/04 - 05/11 (4)
- ► 05/11 - 05/18 (1)
- ► 05/18 - 05/25 (3)
- ► 06/08 - 06/15 (6)
- ► 06/29 - 07/06 (1)
- ► 07/13 - 07/20 (1)
- ► 08/10 - 08/17 (7)
- ► 08/17 - 08/24 (5)
- ► 08/31 - 09/07 (1)
- ► 09/14 - 09/21 (1)
- ► 09/21 - 09/28 (2)
- ► 09/28 - 10/05 (6)
- ► 11/23 - 11/30 (17)
- ► 11/30 - 12/07 (4)
- ► 12/14 - 12/21 (10)
- ► 12/21 - 12/28 (3)
-
►
2009
(44)
- ► 01/18 - 01/25 (2)
- ► 02/08 - 02/15 (5)
- ► 03/22 - 03/29 (2)
- ► 03/29 - 04/05 (1)
- ► 04/12 - 04/19 (1)
- ► 05/03 - 05/10 (8)
- ► 05/10 - 05/17 (1)
- ► 05/24 - 05/31 (17)
- ► 07/26 - 08/02 (1)
- ► 10/25 - 11/01 (3)
- ► 12/20 - 12/27 (3)
-
►
2010
(16)
- ► 01/17 - 01/24 (1)
- ► 01/24 - 01/31 (4)
- ► 01/31 - 02/07 (3)
- ► 05/30 - 06/06 (6)
- ► 08/29 - 09/05 (1)
- ► 10/03 - 10/10 (1)
-
►
2011
(21)
- ► 05/01 - 05/08 (11)
- ► 05/15 - 05/22 (10)
Hi ! I AM A SCIENCE TEACHER.

- savitadhutti
- Delhi, Delhi, India
- I AM A SCIENCE TEACHER IN A WELL REPUTED SCHOOL IN INDIA. I AM A MEMBER OF e-shiksha CLUB. I HAVE JOINED TEACHERTUBE FORUM AS WELL. I AM EXPLORING NET TO LEARN AND SHARE.
Nature and you
MOLECULES IN NATURE FORM BONDS JUST LIKE YOU ARE BONDED TO YOUR FRIENDS.